
Overview
A measure of central tendency is a single value that attempts to describe a set of data by identifying the central position within that set of data. As such, measures of central tendency are sometimes called measures of central location. They are also classed as summary statistics.
The mean (often called the average) is most likely the measure of central tendency that you are most familiar with, but there are others, such as the median and the mode. The mean, median and mode are all valid measures of central tendency, but under different conditions, some measures of central tendency become more appropriate to use than others.
While the mean, mode, and median help us understand the center of a dataset, the range tells us how spread out the values are.
Key Ideas
- Always identify which measure of central tendency the problem is asking for before computing anything.
- The mean is the most commonly used but is sensitive to outliers; when extreme values are present, prefer the median.
- The mode is the only measure applicable to nominal (categorical) data.
- In a perfectly normal (symmetric) distribution, the mean, median, and mode are all equal.
- As data becomes skewed, the mean is pulled in the direction of the skew; the median is more resistant.
- The range is not a measure of central tendency (it measures spread) but it is typically taught alongside mean, median, and mode.
1. Mean (Arithmetic)
The mean is the average of a set of two or more values. It is equal to the sum of all the values in the data set divided by the number of values in the data set. So, if we have values , the sample mean is:
When referring to an entire population rather than a sample, we denote the mean as (Greek letter "mu"), calculated the same way.
An important property of the mean is that it includes every value in your data set as part of the calculation. It is also the only measure of central tendency where the sum of the deviations of each value from the mean is always zero. However, the mean is particularly susceptible to the influence of outliers, values that are unusually small or large compared to the rest of the data.
2. Median
Odd number of values: The median is simply the single middle value. For example:
Even number of values: There is no single middle value, so take the two middle values and average them. For example:
2. Median
The median is the middle value in a data set that has been arranged in order of magnitude (smallest to largest). The median is less affected by outliers and skewed data than the mean.
Calculating with an Odd Number of Scores
Given the data:
1. Arrange in order of magnitude:
2. Identify the middle value (5 scores before, 5 scores after): 56
Note: the term can be found easily to be the 'th term for a list of N terms, where N is odd.
Calculating with an Even Number of Scores
Given the data:
1. Arrange in order of magnitude:
2. Take the average of the 5th and 6th scores:
Note: the terms can be found easily to be the and terms; for a list of N terms, where N is even.
3. Mode
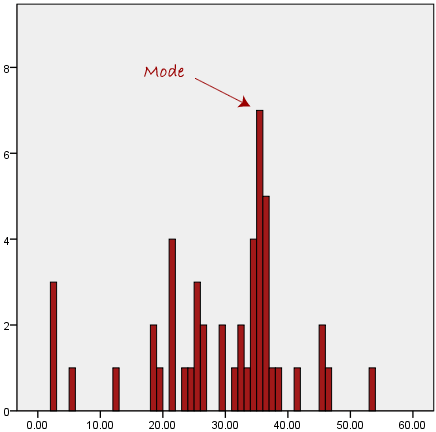
The mode is the value that occurs most frequently in a data set. On a histogram, it corresponds to the highest bar.
- If no value repeats, the data set has no mode.
- The mode is typically used for categorical (nominal) data to identify the most common category.
- The mode is rarely used with continuous data because it is unlikely that any two values will be exactly equal.
4. Range
The range measures the difference between the smallest and largest values in a data set:
The range gives a quick sense of how spread out the data is, but it is influenced by outliers just as the mean is, since it only uses two values from the entire data set.
When to Use Each Measure
| Type of Variable | Best Measure of Central Tendency |
|---|---|
| Nominal (categorical) | Mode |
| Ordinal | Median |
| Interval/Ratio (not skewed) | Mean |
| Interval/Ratio (skewed) | Median |
Key guidance: When data is skewed or contains outliers, prefer the median over the mean. A classic example is income (salary): higher earners skew the mean upward, making it an inaccurate picture of the typical earner, while the median is unaffected.
Worked Example
Dataset: 25, 10, 22, 30, 15, 12, 20, 18, 20
Mean:
Mode:
Arrange in order: 10, 12, 15, 18, 20, 20, 22, 25, 30. The value 20 appears twice; all others appear once.
Median:
There are 9 values (odd), so the median is the 5th value in the ordered list:
Range:
Examples
Example 1: Outlier Effect on the Mean
Consider the wages of 10 staff at a factory (in thousands):
The mean salary is . However, most workers earn between $12k and $18k. The two large salaries are pulling the mean far above what is typical. Here, the median which falls between the 5th and 6th values in the ordered list, both around $15k–$16k gives a far more accurate picture of the typical salary.
Example 2: Even vs. Odd Number of Values
Odd dataset :- 5 test scores: 8, 3, 10, 5, 7.
Arrange in order: 3, 5, 7, 8, 10. Median = 7.
Even dataset :- 4 test scores: 4, 6, 8, 10.
The two middle values are 6 and 8. Median 7.
Example 3: Mode with Categorical Data
An ice cream store records sales on opening day: 40 vanilla, 30 chocolate, 20 strawberry. Since vanilla appears most frequently in the records, vanilla is the mode. The mode is the natural choice here because the data is categorical (it does not make sense to compute a mean or median of ice cream flavors.)
Example 4: Choosing the Right Measure
A soccer player's goals across 7 games: 1, 0, 2, 2, 1, 7, 2.
- Mean: (pulled up by the outlier game of 7 goals)
- Median: Arrange: 0, 1, 1, 2, 2, 2, 7. Median = 2.
- Mode: 2 appears three times. Mode = 2.
Both the median and mode are 2, giving a clearer picture of the player's typical performance than the mean.
Strategy Checklist
- Read the problem carefully and identify exactly which measure is being requested.
- Always arrange the data in order before finding the median or mode.
- For the median with an even number of values, remember to average the two middle values.
- Check whether the data contains outliers or is skewed; if so, the median is usually a better representative than the mean.
- For categorical data, the mode is the only appropriate measure of central tendency.
- For the range, identify the maximum and minimum first, then subtract.
- Verify your answer makes intuitive sense relative to the data set.
Common Pitfalls
- Forgetting to sort the data before finding the median.
- When the data set has an even number of values, reporting one of the two middle values as the median instead of averaging them.
- Using — the product — as the mean formula instead of .
- Reporting multiple values as modes without checking whether the data is truly multimodal or simply has no mode.
- Using the mean when data is heavily skewed or contains outliers.
- Confusing range (a measure of spread) with a measure of central tendency.
- Computing the mean of ordinal or categorical data, where it has no meaningful interpretation.
Practice Problems
Find the mean, median, mode, and range of the following data set: 4, 8, 6, 2, 10, 8, 5.
A data set has values 12, 15, 14, 10, 15, 18, 100. Compute the mean and median. Which better represents the "typical" value, and why?
Seven students scored 72, 85, 90, 85, 78, 92, and 85 on an exam. Find the mean, median, and mode.
In a data set of six values, the median is 14. The ordered data is: 9, 11, ?, ?, 17, 20. What are the two missing middle values if they are equal?
(HARD) A data set of 5 distinct positive integers has mean 10, median 9, and range 12. Find one possible data set satisfying all three conditions.
(CHALLENGE) A class of 20 students has a mean score of 75. After adding one more student's score, the mean drops to 74. What did the new student score?
| Status | Source | Problem Name | Difficulty | Tags | ||
|---|---|---|---|---|---|---|
| AMC 10B | Medium | Show TagsMean, Median, Statistics | ||||
| AMC 10A | Easy | Show TagsNumber Theory, Primes | ||||
| AMC 12B | Easy | Show TagsArithmetic, Statistics | ||||
| AMC 12A | Hard | Show TagsAlgebra, Statistics | ||||
| AMC 12B | Hard | Show TagsAverages, Statistics | ||||
| AJHSME | Easy | Show TagsAverages, Sums | ||||
| AJHSME | Easy | Show TagsArithmetic Mean, Arithmetic Sequences | ||||
| AJHSME | Easy | Show TagsWeighted Average | ||||
| AJHSME | Normal | Show TagsCasework, Mean, Median | ||||
| AJHSME | Easy | Show TagsAverages, Inequalities | ||||
| AJHSME | Easy | Show TagsAverages, Error Analysis | ||||
| AJHSME | Normal | Show TagsHistograms, Percentages | ||||
| AJHSME | Normal | Show TagsAverages, Extremal Values | ||||
| AJHSME | Normal | Show TagsStatistics, Sum | ||||
| AJHSME | Easy | Show TagsHistograms, Median, Statistics | ||||
| AJHSME | Easy | Show TagsAverages, Sums | ||||
| AJHSME | Normal | Show TagsMedian, Statistics | ||||
| AJHSME | Easy | Show TagsAverage, Sum of Sequence | ||||
| AJHSME | Easy | Show TagsOptimization, Statistics | ||||
| AMC 8 | Easy | Show TagsAlgebraic Setup, Weighted Average | ||||
| AMC 8 | Normal | Show TagsAverages, Extremal Principle | ||||
| AMC 8 | Very Easy | Show TagsAverages, Optimization | ||||
| AMC 8 | Easy | Show TagsTable Reading, Weighted Average | ||||
| AMC 8 | Easy | Show TagsAverages, Time Manipulation | ||||
| AMC 8 | Easy | Show TagsAverages, Differences | ||||
| AMC 8 | Very Easy | Show TagsAverages, Sums | ||||
| AMC 8 | Easy | Show TagsPercentages, Weighted Average | ||||
| AMC 8 | Very Easy | Show TagsAverages, Bar Charts | ||||
| AMC 8 | Easy | Show TagsWeighted Average | ||||
| AMC 8 | Normal | Show TagsAverages, Diophantine Equations, Divisibility | ||||
| AMC 8 | Normal | Show TagsAverage Speed, Harmonic Mean, Rate | ||||
| AMC 8 | Easy | Show TagsStatistics | ||||
| AMC 8 | Very Easy | Show TagsData Analysis, Statistics | ||||
| AMC 8 | Easy | Show TagsBar Chart Interpretation, Statistics | ||||
| AMC 8 | Easy | Show TagsStatistics | ||||
| AMC 8 | Normal | Show TagsMedian, Statistics | ||||
| AMC 8 | Very Easy | Show TagsMean, Median | ||||
| AMC 8 | Normal | Show TagsOptimization, Statistics | ||||
| AMC 8 | Very Easy | Show TagsStatistics | ||||
| AMC 8 | Easy | Show TagsAverage, Set Operations | ||||
| AMC 8 | Very Easy | Show TagsArithmetic Mean, Averages | ||||
| AMC 8 | Very Easy | Show TagsBar Graph Interpretation, Median | ||||
| AMC 8 | Very Easy | Show TagsBar Graph, Weighted Average | ||||
| AMC 8 | Easy | Show TagsFractions, Harmonic Mean | ||||
| AMC 8 | Easy | Show TagsAverage, Diophantine Equations | ||||
| AMC 8 | Very Easy | Show TagsAverage, Optimization | ||||
| AMC 8 | Easy | Show TagsData Interpretation, Statistics | ||||
| AMC 8 | Normal | Show TagsData Interpretation, Dot Plot, Median | ||||
| AMC 8 | Normal | Show TagsOptimization, Range, Statistics | ||||
| AMC 8 | Easy | Show TagsAverages, Clock | ||||
| AMC 8 | Normal | Show TagsCasework, Mean, Median | ||||
Module Progress:
Join the Discord Community!
Stuck on a problem, or don't understand a module? Join the Discord and get help with your doubts while making more math friends.