
Interpreting Graphs and Charts
Graphs and charts are used to give a visual representation of data. They condense large amounts of information into easy-to-understand formats that clearly and effectively communicate important points.
Reading a graph or chart means that we can look at the chart or graph and understand what it is trying to tell us. It involves picking out data points of interest and gives a quick synopsis of what the graph is about. Interpreting a graph or chart involves digging a little deeper. This may include completing calculations to determine an average or a sum or difference of data values.
Explore 1 – Interpreting a Bar Graph
The horizontal bar graph shows the percentage of people aged 65 or older in each Local Health District of Utah in 2020.

Horizontal bar graph showing the percentage of people aged 65 or older in each Local Health District of Utah compared to the U.S. average.
1. Estimate the percentage of people who are 65 years old or older in the United States.
Solution: The U.S. bar is at the very bottom of the chart. The bar stretches to somewhere between 16% and 18%. So around 17% of the US population is aged 65 or older.
2. Which areas have a higher percentage of people who are 65 years old or older than the percentage in the United States?
Solution: Drawing a vertical line from the end of the US bar, the bars representing the Southeast and Southwest Health Districts are longer than the U.S. bar.
3. Which area has the lowest percentage of people who are 65 years old or older?
Solution: The lowest percentage is represented by the shortest bar: Utah County Health District.
4. What is the mode of the data and what does it tell us?
Solution: The mode is represented by the longest bar. The mode is the Southwest Health District. This tells us that the Southwest Health District has the greatest percentage of people 65 or older in Utah.
5. What other information would you need to know to be able to calculate a mean from this data?
Solution: Each district has a different population, so to determine a weighted mean we would need to know the population of each district.
6. This bar graph looks almost like a histogram with a tiny amount of space between the bars. Should a histogram be used to represent this data or is a bar graph more appropriate? Explain your answer.
Solution: A bar graph is appropriate since the data is qualitative: nominal and the categories can be rearranged in any order.
Explore 2 – Interpreting a Bar Graph
The bar graph shows the graduation rates by race/ethnicity within 6 years from first institution attended for first-time, full-time bachelor's degree-seeking students at 4-year postsecondary institutions, where the cohort entry year is 2010.

Bar graph showing graduation rates within 6 years for first-time, full-time bachelor's degree-seeking students at 4-year postsecondary institutions, broken down by race and ethnicity.
1. What is the difference (in percentage) between the highest and lowest graduation rates?
Solution: The highest graduation rate is 74% and the lowest graduation rate is 39%. So the difference is 74% – 39% = 35%.
2. A student claims that to find the mean graduation rate of all the students, we can add the seven percentages of bars and then divide the sum by 7. Do you agree? Explain your reasoning.
Solution: Disagree. Each percentage has a different weight (number of graduates), so to calculate the mean, we will have to multiply each percentage by its weight. That is, we need to use a weighted mean.
3. A student claims that there were more Asians who graduated within 6 years compared to the other ethnic groups. Do you agree? Explain your reasoning.
Solution: Disagree. The number of people in each ethnic group is different. Even though the group Asians has the highest graduation rate of 74%, this does not mean that the number of Asians is larger than the number of people in any other ethnic group. We are not told how many graduates are in each ethnic group.
Sometimes two line graphs are combined onto a single graph to highlight what is happening with the data or to tell a story. They may or may not use the same vertical scale. It is important to recognize the scale for each line graph. This is often done using color coding.
Explore 3 – Reading and Interpreting a Line Graph
The line graph shows the number of visitors (the green line) and the number of full-time equivalent employees (FTE, the orange line) of Zion National Park from 2010 to 2022. FTE means the total full-time employees and part-time employees that add up to full-time employees (e.g., four part-time employees who work 10 hours each per week add up to make one full-time employee who works 40 hours per week).
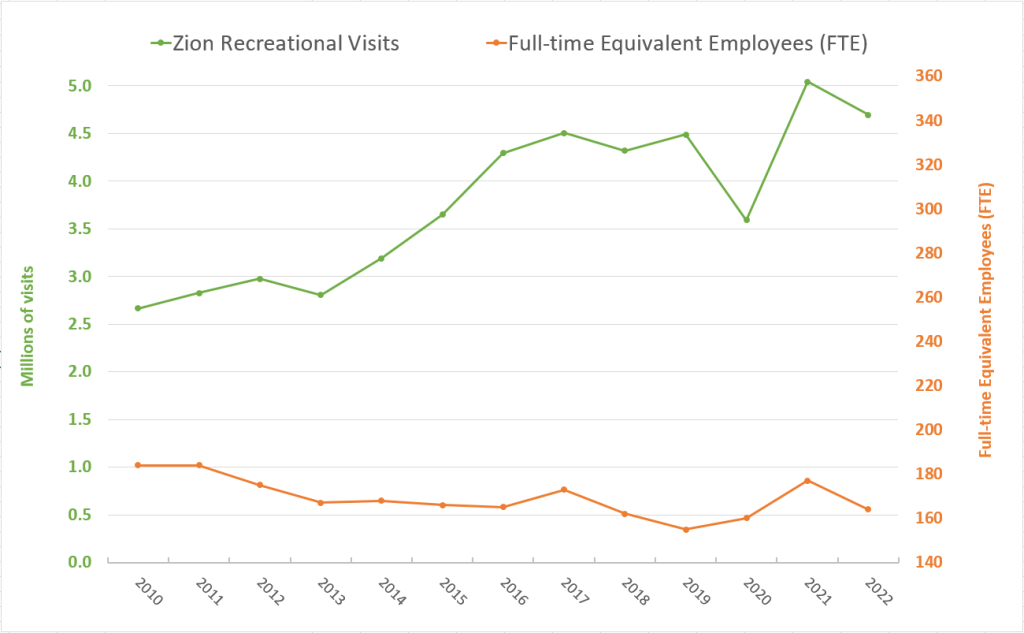
Dual-axis line graph. The green line (left axis) shows number of visitors in millions; the orange line (right axis) shows full-time equivalent employees. Both are plotted from 2010 to 2022.
1. Describe the trend of the upper, green line.
Solution: The trend is a basic idea of what the graph is doing. The upper, green line is basically going up as it moves from left to right. So, the number of visitors increased almost every year from 2010 to 2022.
2. Describe the trend of the lower, orange line.
Solution: The lower, orange line is basically decreasing as it moves from left to right. The number of FTE decreased almost every year from 2010 to 2022.
3. What was the increase in visits from 2010 to 2022?
Solution: The number of visitors is represented by the green line whose scale is on the left vertical axis. In 2010, the number of visitors was about 2.7 million and in 2022 it was about 4.7 million. The difference is 4.7 million – 2.7 million = 2 million. So, the number of visitors increased by about 2 million people.
4. What was the decrease in FTE from 2010 to 2022?
Solution: FTE is represented by the orange line whose scale is on the right vertical axis. The FTE in 2010 was about 181 and in 2022 is about 162. The difference is 162 – 181 = –19. So, FTE decreased by 19 full-time equivalent employees.
5. The upper (green) and lower (orange) lines get further apart as the graphs move from 2010 to 2022. What does this tell us?
Solution: As the upper (green) line increases the lower (orange) line decreases, telling us that although the number of visitors increased, the number of full-time equivalent employees decreased.
Explore 4 – Interpreting Line Graphs
The two graphs show the growth (Chart 2) and loss (Chart 3) of non-government-controlled businesses from 2016 to 2021 in terms of the number of jobs offered (gross job gains) and the number of jobs lost (gross job losses). Gross job gains are the sum of increases in employment due to expansions at existing establishments and the addition of new jobs at opening establishments. Gross job losses are the result of contractions in employment at existing establishments and the loss of jobs at closing establishments.
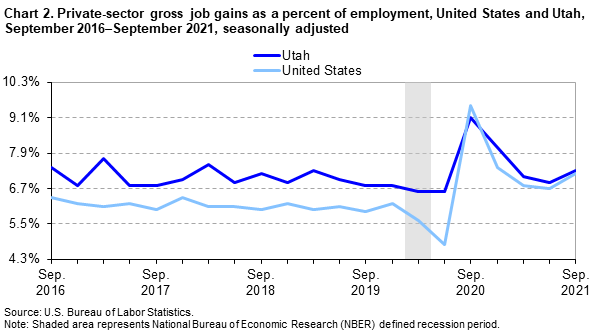
Line graph comparing gross job gain rates (%) for Utah (dark blue) and the U.S. (light blue) from 2016 to 2021. A grey shaded rectangle marks the defined recession period.

Line graph comparing gross job loss rates (%) for Utah (dark blue) and the U.S. (light blue) from 2016 to 2021. A grey shaded rectangle marks the defined recession period.
1. What does the top graph (Chart 2) tell us about Utah's job growth rate compared to the job growth rate of the U.S.?
Solution: Overall, the dark blue line representing Utah's job growth rate lies above the light blue line representing the job growth rate of the US. This means that overall Utah has a higher job growth rate than the U.S.
2. What does the bottom graph (Chart 3) tell us about Utah's job loss rate compared to the job loss rate of the U.S.?
Solution: Overall, the dark blue line representing Utah's job loss rate lies above the light blue line representing the job loss rate of the US. This means that Utah's job loss rate is slightly higher than that of the U.S. overall.
3. It has been said that Utah's business growth rate is near the top of all states in the US. Is the statement true, according to the two line graphs? Explain your reasoning.
Solution: It is not true. First, the two graphs do not contain the information that Utah is near the top of all states in the U.S. Second, although Utah has higher gross job gains (about 1%), Utah also has higher gross job losses (about 1%) compared to the average of the United States.
4. A student claims that Utah's business growth from 2016 to 2019 was a lot better than the average growth of the United States because the distance between the two lines (dark and light blue) is quite large. Do you agree? Explain your reasoning.
Solution: Although it seems the two lines are not close, the difference actually hovers around 1%. Therefore, it is more important to read the scale marks to find the numerical difference instead of depending on how far the two lines are away from each other.
5. What does the grey vertical rectangle represent on the graphs?
Solution: The grey vertical rectangle shows the time period that was defined as a recession period.
6. What was the highest job loss rate for the U.S. and for Utah? How does it relate to the recession period?
Solution: The peak on Chart 3 shows the highest value around 17% for the U.S. and 11% for Utah. This was right after the defined recession period ended.
Part 2: Check the Part 2 for the continuation!!
Module Progress:
Join the Discord Community!
Stuck on a problem, or don't understand a module? Join the Discord and get help with your doubts while making more math friends.